
Why Server Latency Decides How Much of Your Hashrate Actually Counts
A mining pool pays for accepted shares, and the distance between your machines and the node they connect to decides how many of those shares arrive before they expire. On a 900 TH/s setup earning about $34.19 a day gross, a two-point difference in the stale-share rate — 0.5% versus 2.5% — is worth roughly $0.66 a day in net income, or about $240 a year, for identical hardware at an identical power cost. Latency is the cheapest performance upgrade most farms never buy.

Key takeaways
- Reported hashrate is what the machine claims; effective hashrate is what the pool accepted and paid for. The gap between them is the latency bill.
- A 1% stale-share rate costs about $0.34 a day at 900 TH/s and roughly $0.04 a day at 90 TH/s — small per machine, large across a fleet.
- Under PPS+ the pool absorbs pool-luck and orphan risk for a listed 4% fee on the block-reward component; it cannot absorb shares that arrive after the template they were built for has expired.
- Choose the node region by measured round-trip time from the farm, and re-measure after any ISP, rack or firmware change.
Definitions first
A share is a solution that meets the pool's easier target. A stale share is one submitted for a job that has already been superseded, usually because a new block was found somewhere on the network before your machine's answer arrived. The work happened; the credit does not. That is the whole mechanism, and it has nothing to do with the quality of your hardware.
Two more terms matter for the arithmetic. Reported hashrate is the machine's own claim, calculated from the difficulty of the shares it is producing. Effective hashrate is the pool's view after discarding everything it could not use. When a miner says "my hashrate is fine but my payout is low", the two numbers are usually diverging, and latency is the first thing to test.
Finally, settlement design shapes how much a millisecond costs you. ViaBTC, which runs a global node deployment aimed at low latency, pays the PPS-settled block-reward component hourly against current difficulty and combines block rewards with transaction fees under PPLNS after six confirmations, weighted by your share over the last five difficulty rounds.[1]
The trade-off nobody prices
Farms compare pools on fee percentage, payout threshold and coin list, then connect to whatever node address the setup guide suggests. The node choice rarely appears in a spreadsheet, even though it is the one variable that changes credited hashrate without changing power draw. A pool with excellent fee terms but a distant node can return less than a pool with slightly worse terms and a node in your own metro area.
The reason is structural. Between a new block being found and your machine switching to the next template, there is a window. Work completed against the old template during that window is discarded. Distance widens the window, and so does jitter — the variance around your average round-trip time. A stable 80 ms path and a spiky 80 ms average path produce different stale rates, because it is the tail that loses shares.
| Reading | Where it comes from | Cost when it drifts |
|---|---|---|
| Effective versus reported hashrate | Pool dashboard, per worker | A 1% gap is about $0.34 a day of gross income at 900 TH/s |
| Stale share ratio | Accepted versus submitted shares | 2% stale is about $0.68 a day, close to $250 a year |
| Round-trip time to the node | Your own measurement, at peak hours | Shows up as the two lines above rather than as a line item |
| Reject reason breakdown | Per-worker status and reject log | Separates a latency fix from a hardware fix before you spend on either |
| Worker uptime | Hashrate history and alerts | A 12-hour outage at 900 TH/s is roughly $17 of gross income plus the power already burned |
Example with two setups
Both setups run 900 TH/s at 20 J/TH, which is 18 kW and 432 kWh a day — about $25.92 of electricity at $0.06/kWh. Both are pointed at the same payment model, so the listed 4% fee on the PPS-settled block-reward component applies identically.
Setup A connects to a node a short hop away and returns a 0.5% stale rate. Effective hashrate is 895.5 TH/s, which is about $34.02 gross a day and $32.66 net of the listed fee. Setup B uses identical machines but a distant node with a spikier path and returns a 2.5% stale rate. Effective hashrate is 877.5 TH/s, worth roughly $33.34 gross and $32.00 net. The difference between the two is $0.66 a day, about $20 a month, and it survives every change in coin price, because it is a ratio rather than a rate.
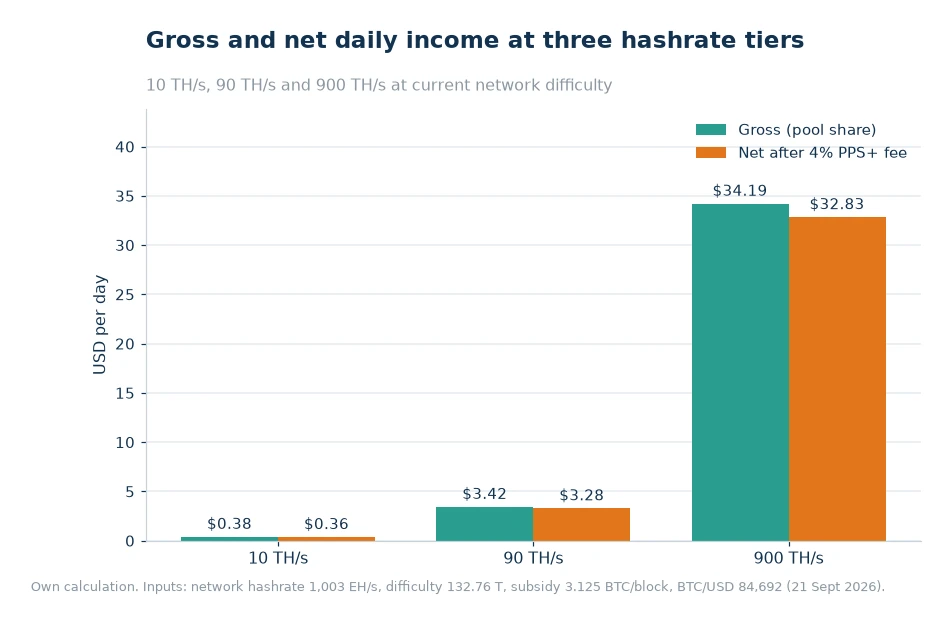
The same ratio scales down smoothly. A single 90 TH/s machine bills about $3.42 gross and $3.28 net a day at current difficulty, and a 2% stale rate quietly removes about $0.07 of that. A 10 TH/s unit earns $0.38 gross and $0.36 net, where latency losses are lost in the rounding of a power bill. That is exactly why the problem is easy to miss on a small farm and expensive on a large one: the effect is proportional, and proportion only bites when the absolute numbers are big enough to notice on a monthly statement.
There is an offsetting consideration that honest comparisons should include. A distant node with a good job-propagation setup may still beat a near node with poor propagation, because the pool's own internal freshness matters as much as your distance to it. That is why the practical test is empirical: measure round-trip time from the farm, then watch effective hashrate per worker for a week at the same difficulty. The pool that returns the higher effective number wins, whatever the map suggests.
Where the account lands matters too. Income that settles hourly can be held and converted without an extra transfer, and a profit calculator that accepts your real effective hashrate — rather than the number printed on the box — produces a more useful estimate before you commit capital to a site.
Practical next steps
- Measure, do not assume. Run a steady round-trip test from the farm to each candidate node region for 24 hours, and note the worst case, not the average.
- Compare effective hashrate across regions. Point half the fleet at each candidate node for a week and compare credited output per worker at the same difficulty.
- Fix the cheap things first. Cable quality, switch load and firmware job-refresh settings cost nothing and occasionally recover more than a node change does.
- Watch the reject reasons. A mining pool dashboard that exposes per-worker data makes it possible to tell stale submissions apart from hardware errors, which are two different repairs with two different budgets.
- Look at the whole service, not just the ping. Fee components, payout cadence, supported chains and uptime history are part of the same decision; ViaBTC Mining Pool publishes its node coverage and settlement terms, and reports serving miners in 150+ countries, which is the kind of claim you can test against your own round-trip numbers.[2]
- Re-check after every change. A new ISP contract, a moved rack or a firmware update all reset the baseline.
Frequently asked questions
Does the payout method change my average income?
It changes the variance and the fee, not the underlying expected value: your share of network hashrate still sets the ceiling.
How often should a miner check pool statistics?
Weekly is enough for cash flow, daily if you are reconciling worker uptime or chasing a hashrate fault.
Is latency relevant if my pool is large?
It is independent of pool size. Size affects payout variance; distance affects how much of your submitted work is credited. A large pool with a well-placed node for your region is the combination worth looking for.
One measurement this week
Pick the worker with the worst effective-to-reported hashrate ratio in the fleet and trace its path: switch, uplink, route, node region. Write down the worst-case round-trip time, not the average, and compare it with a worker in another region doing the same job. If the ratio improves when the second worker is pointed at a nearer node, you have found a recurring saving that costs nothing to keep. Then fold that recovered hashrate back into your revenue estimate before you decide whether the next hardware purchase is actually necessary.
Data and sources: ViaBTC payment-method and fee documentation[1] and ViaBTC site information on node coverage and settlement[2]. Network difficulty (132.76 T), network hashrate and BTC/USD (84,692) read from public chain data on 21 September 2026. Stale-share costs and electricity figures are own calculations from those inputs and change with difficulty, price and local tariffs. Read on 21 September 2026.